![[Excel] How to make a step chart](/assets/images/img_video/video-tutorials-header.png)
[Excel] How to make a step chart
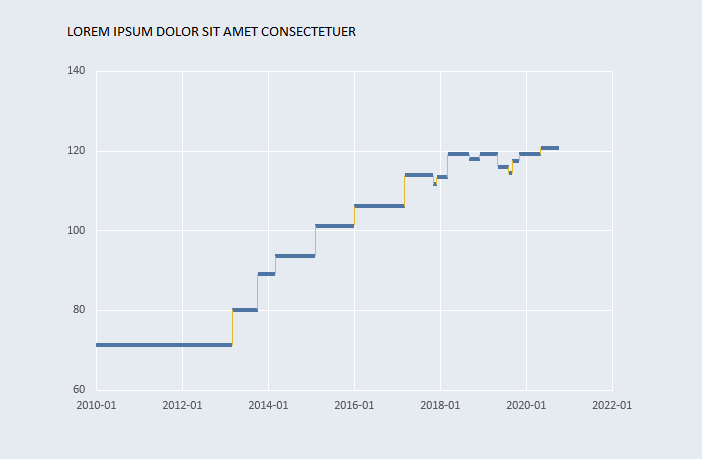
A step chart shows change over time as a succession of sudden, non-continuous changes.
Design notes
- Excel doesn’t offer a step change as a connection option for a line chart, so error bars need to be used instead.
- The horizontal lines uses x-axis error bars, while the vertical lines use y-axis error bars.
- Since each step is composed of two lines, we can apply different properties for each of them.
Video
Notes
- 00:10: the formula for the new column [X] calculates the difference between the current date and the previous date.
- 00:20: the formula for the new column [Y] calculates the difference between the current price and the previous price.
- 01:00: to create the horizontal lines, only one direction of the error bars is necessary, and the cap is removed.
- 01:15: the vertical line uses the plus direction of the y-axis error bars.
- 02:05: set the scale for the x-axis to start at the minimum date (defined as a number); if you don’t know, use the MIN() function to get it and use the returned value.