![[Excel] How to make a simple scatterplot](/assets/images/img_video/video-tutorials-header.png)
[Excel] How to make a simple scatterplot
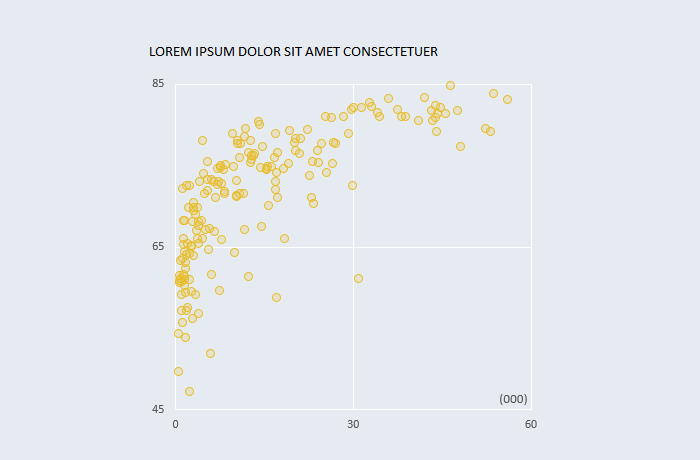
A scatterplot displays the relationship between two variables and is essential for higher level insights.
Design notes
- Check the aspect ratio.
- Reduce opacity to avoid occlusion (overlapping data points).
- Show dot outline using a darker color.