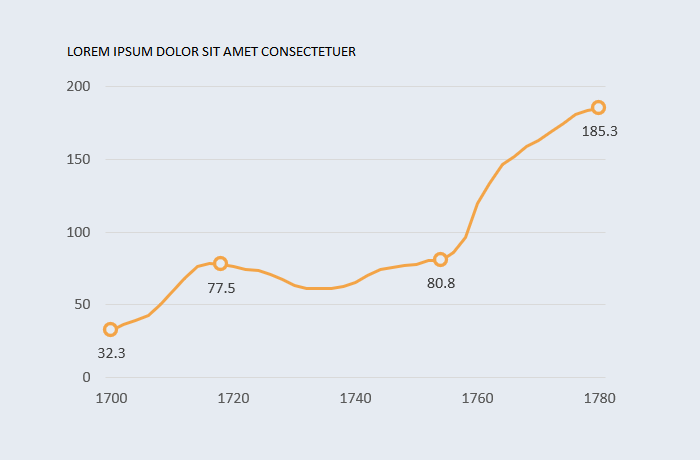
[Excel] How to make a line chart with custom markers
Add markers to dynamically highlight relevant data points in a series.

Design notes
-
You don’t need a dummy series to add markers: you can simple select a data point and change several properties, including adding or removing markers. The advantage of using a dummy chart is that these markers can be dynamically configured (minimum, maximum, last, specific date…).
-
The formula checks if the lookup table contains the current year. If so, it gets the data point, if not, adds NA().
Video
Notes
-
Formula for displaying the dummy series:
=IF(ISERROR(MATCH([@Year],Table7[Year],0)),NA(),[@Exports])
![[Excel] How to make a line chart with custom markers](/assets/images/img_video/video-tutorials-header.png)