![[Excel] How to make a hemicycle plot](/assets/images/img_video/video-tutorials-header.png)
[Excel] How to make a hemicycle plot
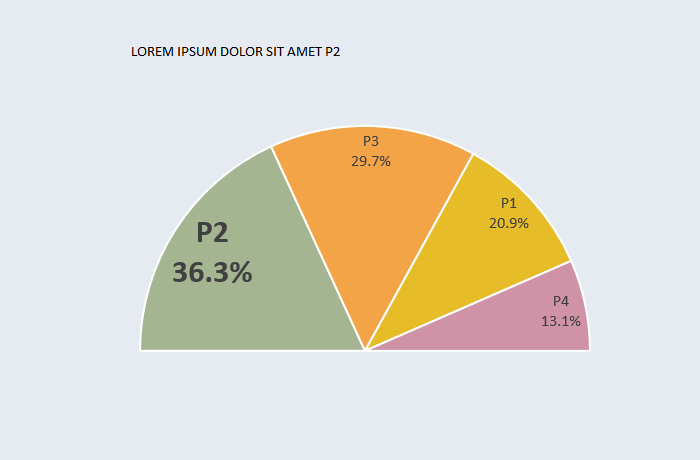
Hemicycle charts are useful to communicate how the results of elections translate into number of MEP. The hemicycle replicates the shape of many parliament chambers.
Design notes
- Label the slices directly
- Use political party colors
- Since you have to include a hidden hemicycle (the lower part) you can’t use percentages calculated by Excel. Get the labels from a range where those percentages are calculated.