![[Excel] How to make a vertical range dotplot with average](/assets/images/img_video/video-tutorials-header.png)
[Excel] How to make a vertical range dotplot with average
A useful vertical range plot with a central point.
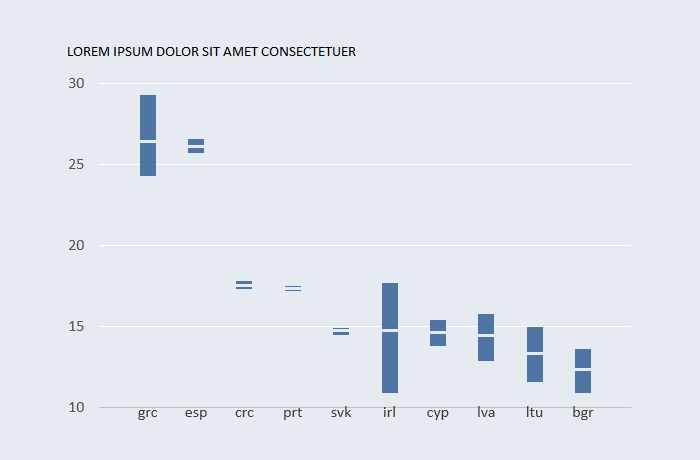
Design notes
- Use this to represent gaps and differences to the central value.
Video
Notes
- 00:15: Columns [LimSup] and [LimInf] calculate the difference between [Max] and [Avg], and [Min] and [Avg]; they will be used to define error bars.
- 02:10: Column [Y0] is used to place x-axis labels.