![[Excel] How to make a simple bubble strip](/assets/images/img_video/video-tutorials-header.png)
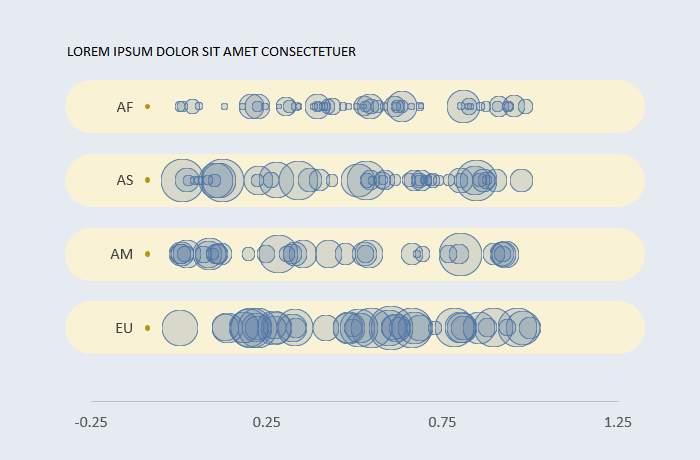
[Excel] How to make a simple bubble strip
A strip plot that uses bubbles, encodes data into bubble sizes and splits the plot by category.
Design notes
- Set transparency to a high value to manage overlapping bubbles
- Sort by size (decreasing) for the same reason.
- Grid width here is very large simply for aesthetics reasons, but you could use it to create some kind of reference line.
- Setup a secondary table for labels.
Video
Notes
00:50: Maximum is set to 49 to avoid displaying the gridline at 50 while leaving some room for the bubbles.