
Making charts with Excel
Excel has a bad reputation when it comes to “serious” visualization. To be honest, I find some of it well deserved.
But Excel is also flexible, and it allows you to go much beyond what its poor library seems to offer. The problem with Excel is that you often have to find workarounds to make a chart that other tools make available without all that guesswork. So it’s not a matter of whether Excel can do it but decide if it makes sense to do it in Excel.
When making a chart in Excel, the general flow is pretty standard: select the data → choose the chart → format → add text. But in Excel, where workarounds abound, there is a lot more than this linear flow:
- You often need to add extra (dummy) rows or/and columns to your data table to achieve specific visual effects.
- Although this more minor an issue in recent versions, you still need to remove unnecessary objects.
- The more interesting charts often use multiple geometries, but not the ones predefined in the library.
- Use gradients for variation bands.
- Use error bars to create dot plots, lollipop charts, custom grid lines, vertical markers, and many more.
- Create custom labels using labels from a range.
- Use the REPEAT() function to create a bar chart without a chart.
- Use conditional formatting to fill cells and generate heat maps.
As you can see, you have to be creative to mimic in Excel some of the options that are available out of the box using other tools. This need for workarounds increases chart complexity and takes longer than activating that option.
How to make a chart in Excel
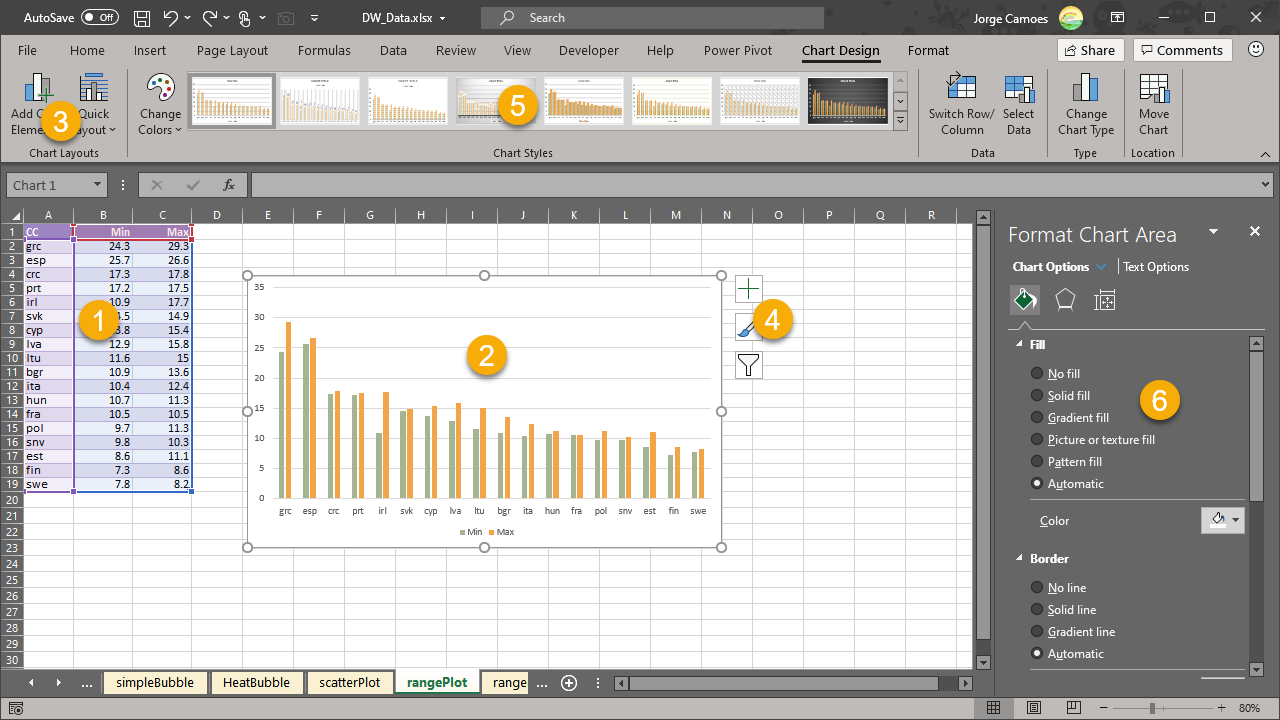
- Create a well-structured data table (1).
- Select it and from the Insert menu, choose a chart from the chart library. A bar chart should look like (2).
- Check if there is a Quick Layout (3) that improves the default one.
- Do the same with Chart Styles (5).
- Add chart elements using (3) or (4).
- You can make changes to individual objects by right-clicking and use the panel (6) to format them.