![[Excel] How to make a bubble heatmap](/assets/images/img_video/video-tutorials-header.png)
[Excel] How to make a bubble heatmap
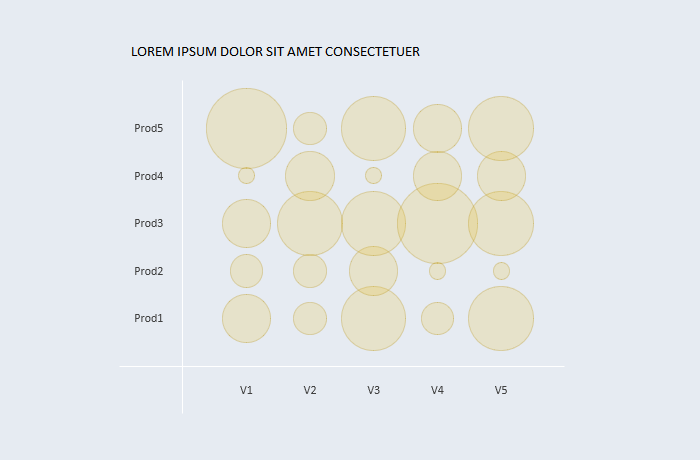
Excel can’t encode color gradients, but you can use bubble size to create a passable heatmap.
Design notes
- Much of the effectiveness of heatmaps resides on how the categorical axes are sorted. Try to sort them (manually, if needed) in a way that similarly sized bubbles are clustered together.
- Check for outliers in the variable you use for bubble size
- To display the center of the bubble, add the series twice, but use a small and fixed value for bubble size.
- Check the aspect ratio.
- Reduce opacity to avoid occlusion (larger bubbles hiding smaller ones).
- Show bubble outline using a darker color.